
Visualizing the
transportation shift
in Germany
Comparing the usage of public transport and cars for
the years from 2013 to 2022 across all federal states.


What is this project about?
🔍 Background
Our project aims to visualize the ongoing transportation shift in Germany, focusing on the development of public transportation and car usage over the past years. To achieve this, we used data from the Federal Statistical Office of Germany combined with a dataset from an Insurance Platform. The main research question is whether a shift has occurred and when significant changes took place. The graphics also cover which federal states were successful in extending their public transportation offerings and which were not.
✨ Relevance
In a time when environmental sustainability and the transition in transportation are hot topics, this project addresses a subject frequently debated in news and politics. With a focus on providing transparent and detailed insights, the project aims to cut through the rhetoric, offering a clear understanding of how the shift in transportation has unfolded over recent years and where significant changes have occurred.
🎯 Objectives
Through comprehensive data analysis, we found several insights and selected the most interesting ones. We placed them in a fully explorable set of key findings showcased within a dashboard of multiple visualizations. All of these key findings have a timeline that allows you to traverse through several selected years, a bar chart that visually reflects our findings, and a map that depicts a geographical overview of regional differences.


What do you want to research?
To continue, select a key finding you would like to explore!
🚉 Transportation Shift
See how the usage of transportation means has evolved between 2013 and 2019. Take a deeper look at how public transportation and cars compete and examine which states were successful in their strategy for transportation shift and which not.
🦠 Covid Impact
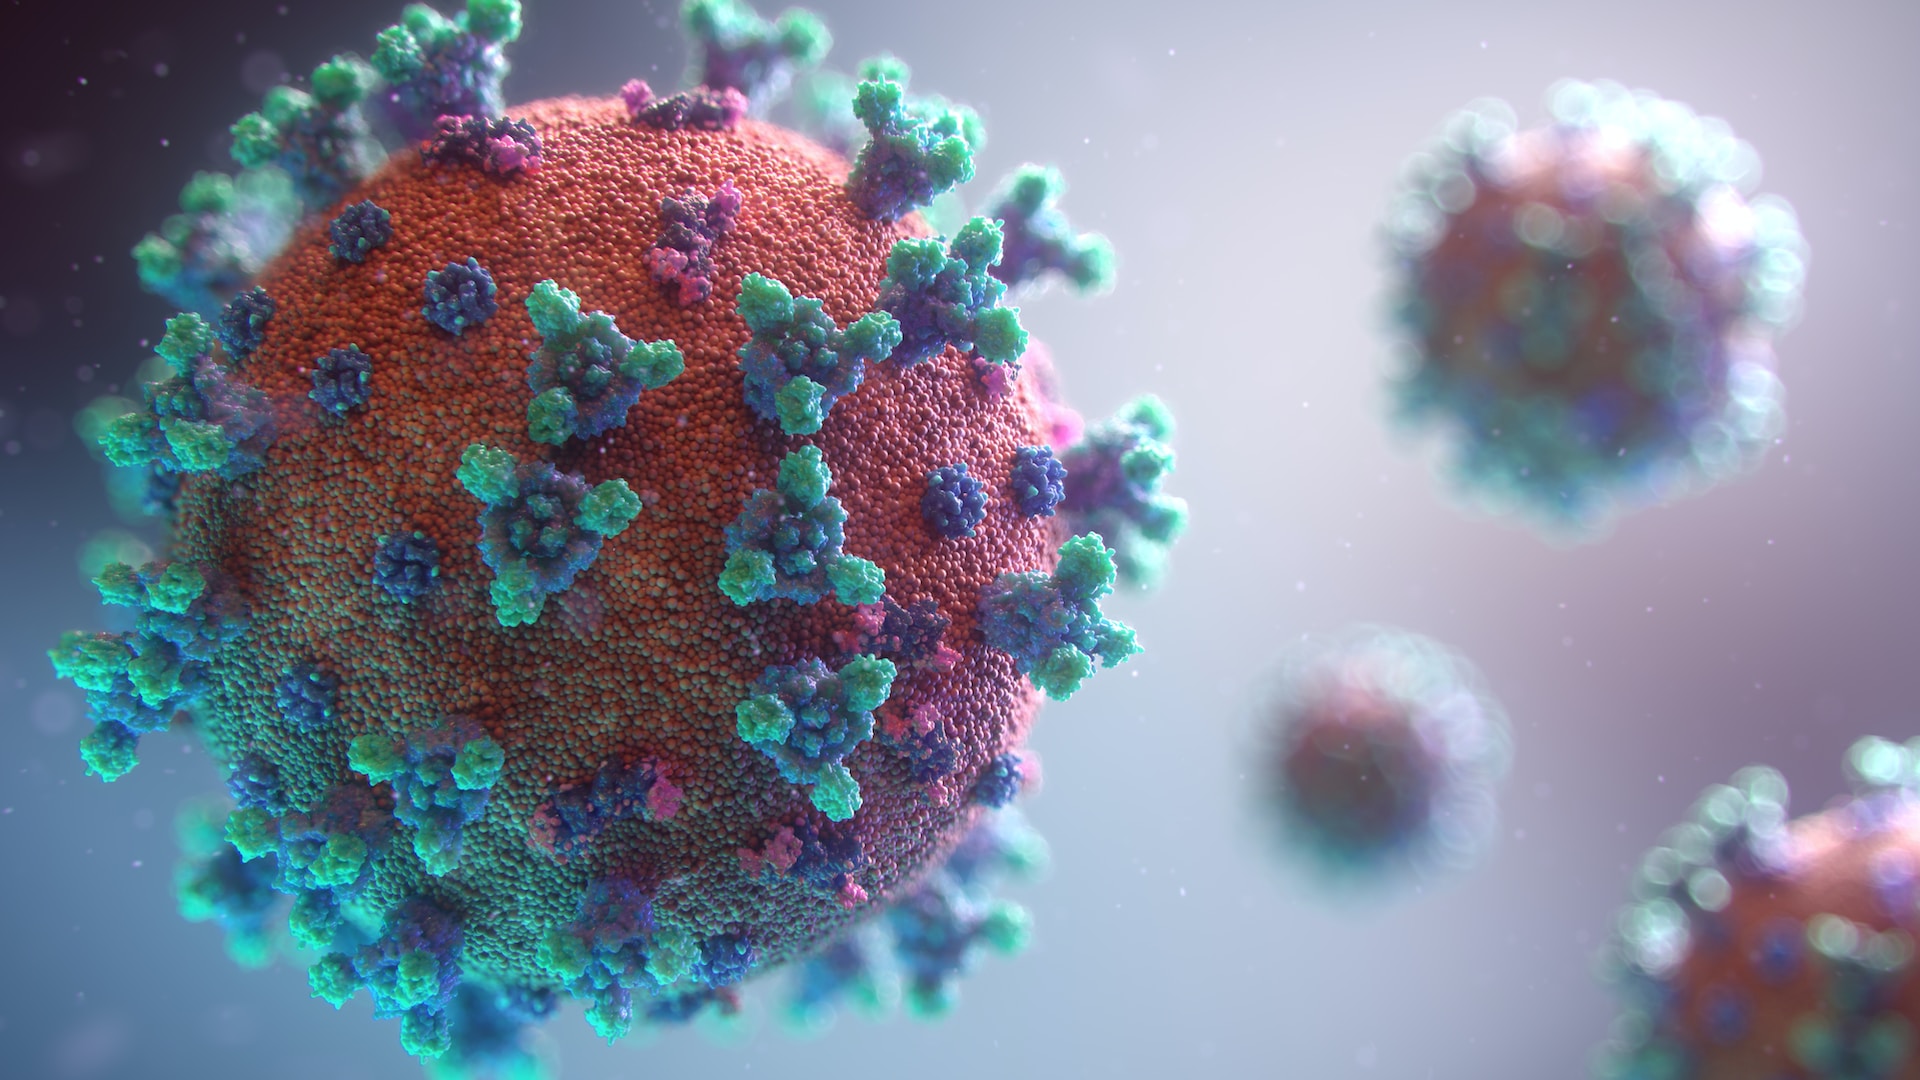
Due to the Covid-19 pandemic, the usage of public transportation has decreased significantly. Explore the impact of the pandemic on transportation in Germany between the years from 2019 to 2022.
🚗 Cars in Germany
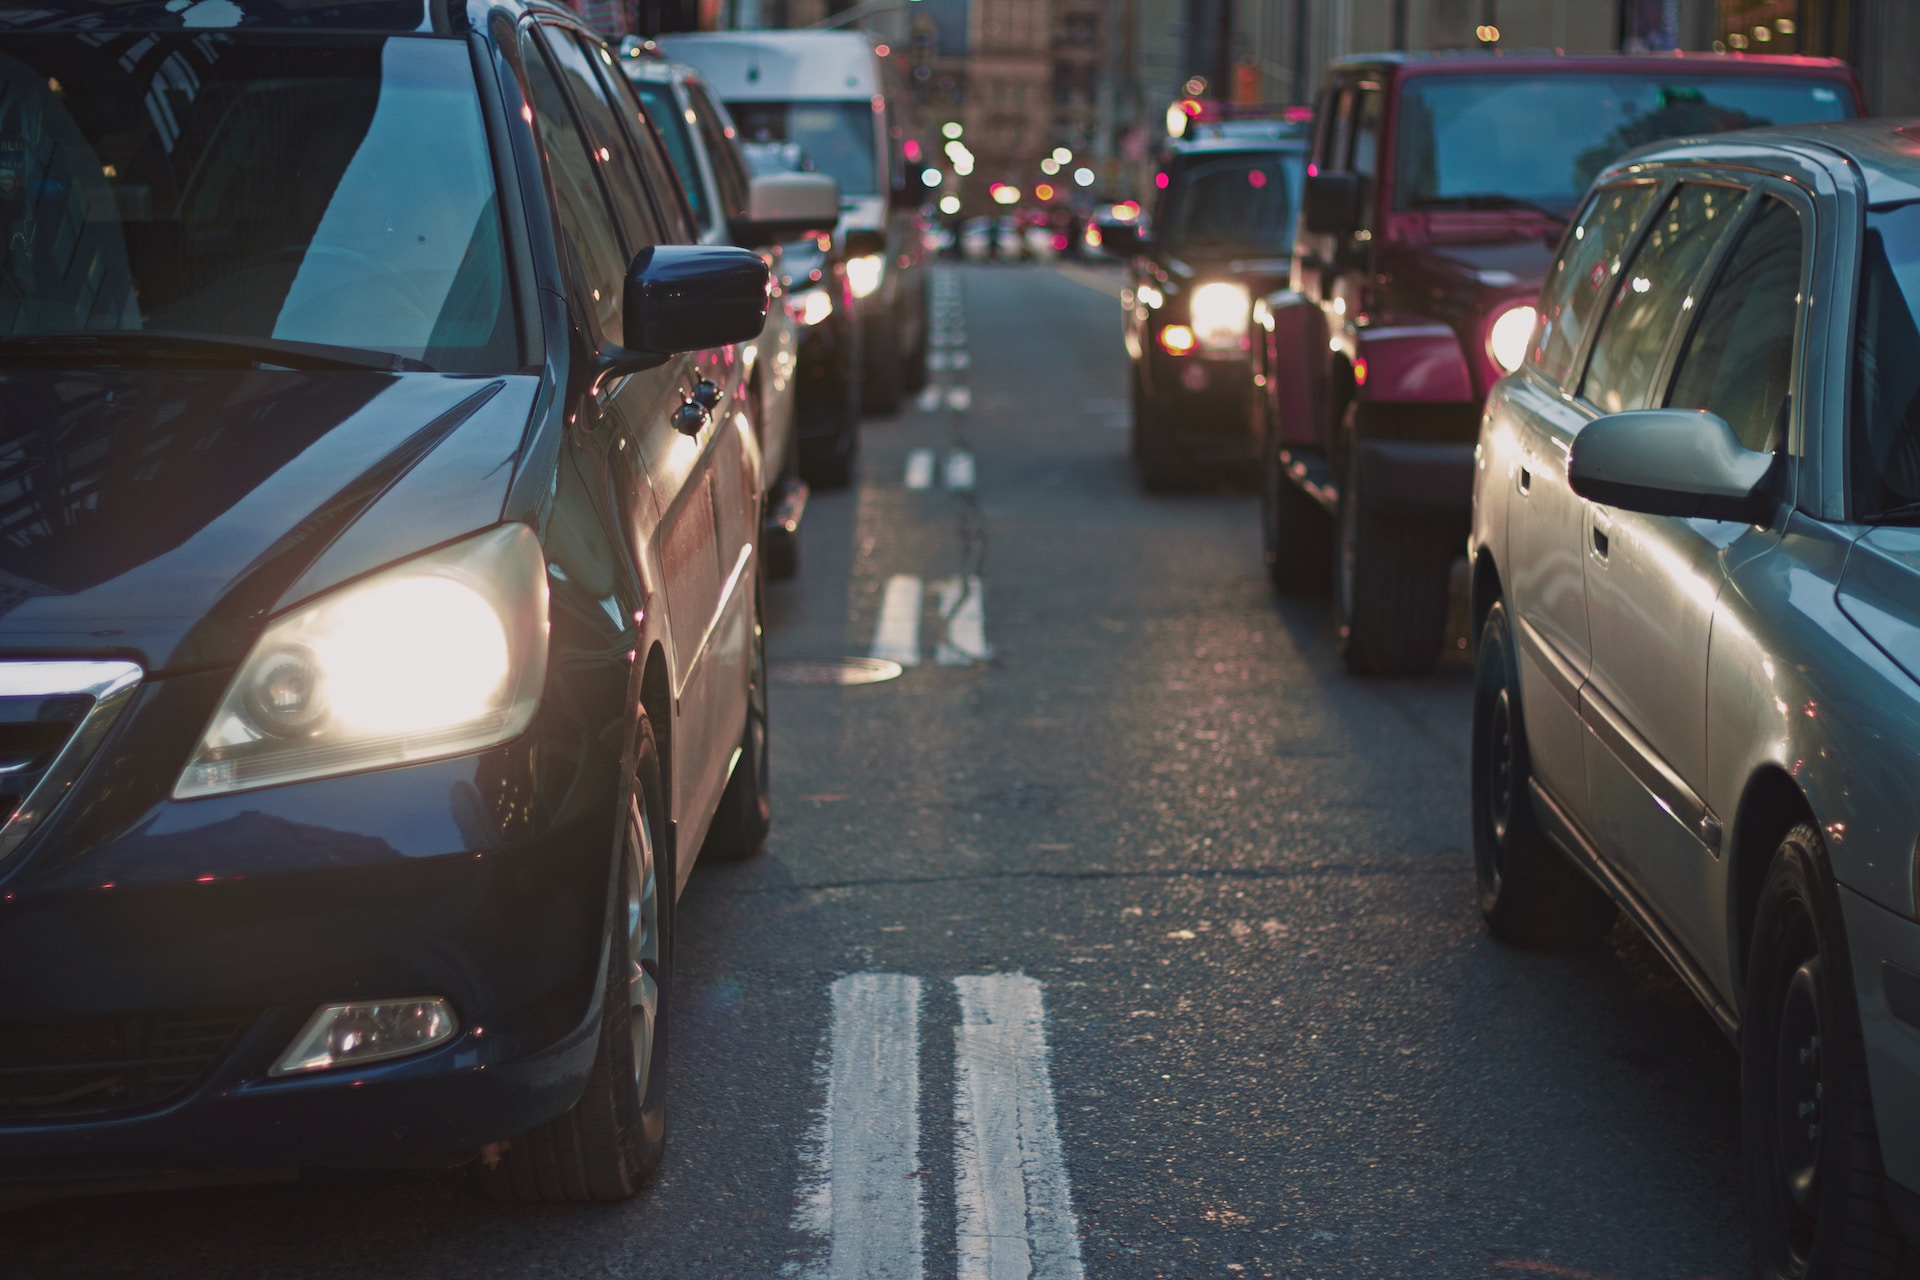
Germany is well known for its car industry. But how much are people actually driving? Are there now more cars on the road than before? Check out how these metrics have evolved from 2013 to 2022, and examine the leading states in car usage.
Who are we?

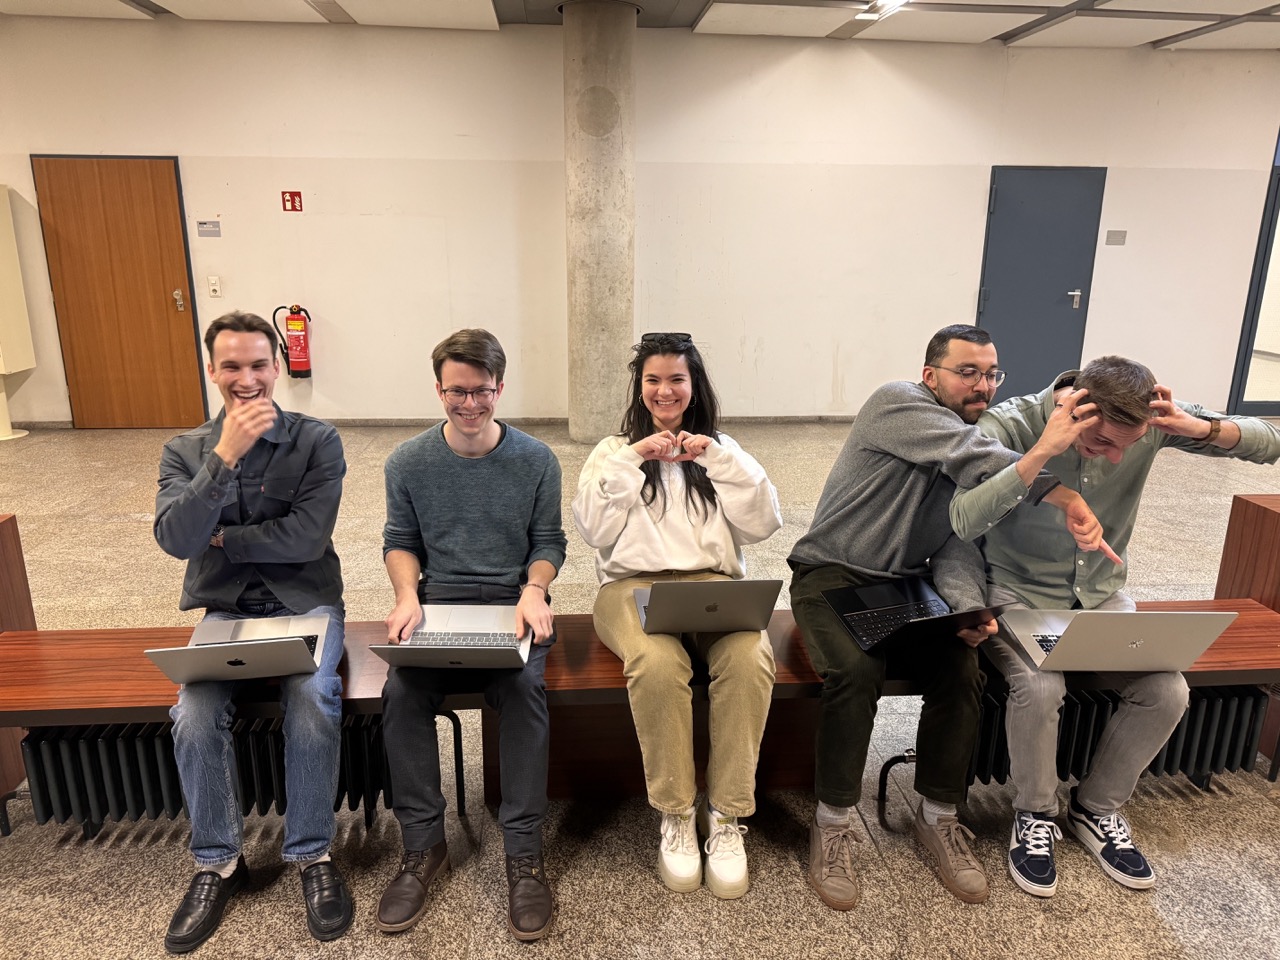
Lukas Plenk
I’m a Human-Computer-Interaction student at LMU Munich interested in digital media, culture, and traveling. Just like public transport, I’m always out for the next destination ahead.

Amiin Najjar
HCI student with a passion for sport and cooking, swapped public transportation for pedaling my bike, blending tech with a dash of culinary creativity and a healthy dose of physical activity.

Timothy Summers
I love collaborating in a team and solving creative challenges! Always ready for adventure - I can even handle Munich public transportation during rush hour!

Malek Jarraya
I’m a Media Informatics student at LMU Munich. I love colors, the sun, and the sea. I didn't know much about public transportation in the past, but our project definitely changed that.

Maximilian Wiegand
Hey, I'm a media computer science student at LMU Munich. I love to design, develop and explore. Some ideas even came up in delayed and overcrowded public transport …